Vehk Axle Dashboard
Complete guide to navigating and using the Vehk Axle dashboard.
Dashboard Overview
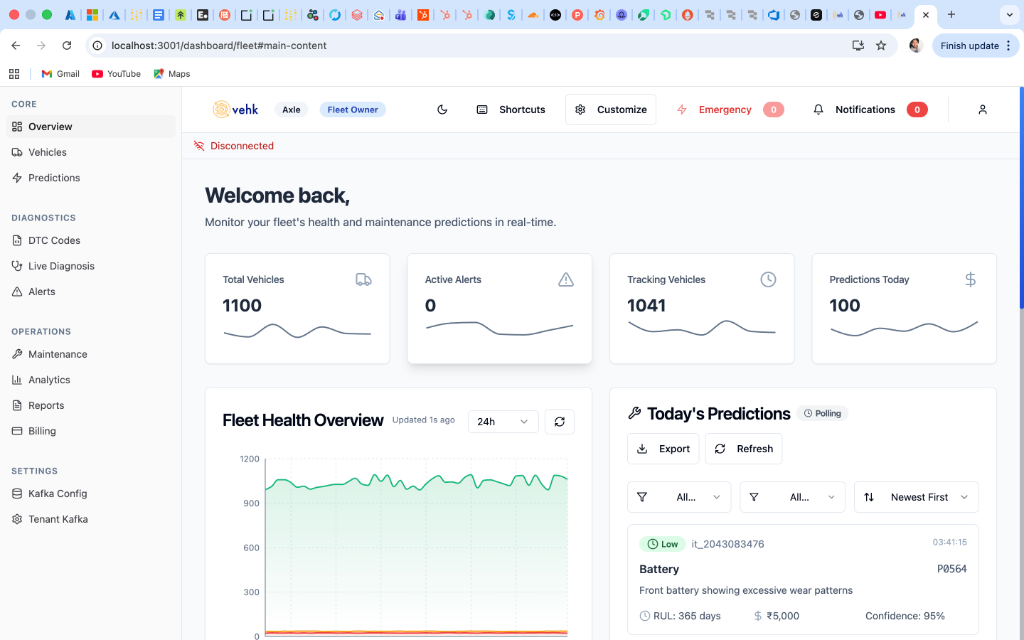
The dashboard provides real-time visibility into your entire fleet with predictive maintenance insights.
Navigation
Left Sidebar
The sidebar is organized into three main sections:
CORE
| Menu Item | Description |
|---|---|
| Overview | Main dashboard with fleet summary and health metrics |
| Vehicles | View and manage all vehicles in your fleet |
| Predictions | AI-powered maintenance predictions |
DIAGNOSTICS
| Menu Item | Description |
|---|---|
| DTC Codes | Active Diagnostic Trouble Codes across fleet |
| Live Diagnosis | Real-time vehicle diagnostics |
| Alerts | Critical and warning alerts |
OPERATIONS
| Menu Item | Description |
|---|---|
| Maintenance | Schedule and track maintenance work |
| Analytics | Fleet-wide analytics and trends |
| Reports | Generate and download reports |
| Billing | Subscription and usage billing |
SETTINGS
| Menu Item | Description |
|---|---|
| Kafka Config | Configure data streaming settings |
| Tenant Kafka | Multi-tenant Kafka settings |
Home Page (Overview)
Key Metrics Cards
At the top of the dashboard, you'll see four key metrics:
| Metric | Description | Example |
|---|---|---|
| Total Vehicles | Total vehicles in your fleet | 1100 |
| Active Alerts | Alerts requiring attention | 0 |
| Tracking Vehicles | Vehicles currently sending telemetry | 1041 |
| Predictions Today | ML predictions generated today | 100 |
Fleet Health Chart
The Fleet Health Overview chart shows:
- Real-time health score trends (0-1200 range)
- 24-hour or custom time range views
- Auto-refresh with last update timestamp
Today's Predictions Panel
View all predictions generated today:
- Severity badges: Low (green), Medium (yellow), High (red)
- Vehicle ID: Which vehicle the prediction is for
- Component: Battery, Engine, Brakes, etc.
- Issue: Description of the predicted issue
- RUL: Remaining Useful Life in days/km
- Estimated Cost: Predicted repair cost
- Confidence: ML model confidence score
Vehicles Page
Click Vehicles in the sidebar to see:
Vehicle List
- All vehicles with health scores (color-coded)
- Last location and update time
- Driver assignment
- Quick status: Online/Offline
Vehicle Details
Click any vehicle to see:
- Real-time telemetry (speed, RPM, temperature, fuel)
- Health score with component breakdown
- Recent alerts and predictions
- Maintenance history
- Location on map
Predictions Page
The Predictions page shows AI-generated maintenance predictions:
Prediction Cards
Each prediction includes:
- Severity Level: Low, Medium, High, Critical
- Component: Which part needs attention
- Issue Description: What the ML model detected
- RUL: Remaining Useful Life estimate
- Cost Estimate: Expected repair cost
- Confidence Score: How confident the model is (0-100%)
Filters
- Filter by severity
- Filter by component
- Filter by vehicle
- Sort by date, RUL, or confidence
Alerts Management
Alert Types
| Type | Color | Description |
|---|---|---|
| Critical | 🔴 Red | Immediate safety risk - stop vehicle |
| High | 🟠 Orange | Maintenance needed within 7 days |
| Medium | 🟡 Yellow | Schedule maintenance this month |
| Low | 🔵 Blue | Informational - optimization tips |
Alert Actions
- Mark as acknowledged
- Assign to technician
- Schedule maintenance
- Add notes
Reports
Generate reports from the Reports section:
Available Reports
- Fleet Health Summary
- Maintenance Cost Analysis
- Prediction Accuracy Report
- Vehicle Utilization Report
- Driver Performance Report
Export Options
- PDF download
- Excel export
- Email scheduled reports
Top Navigation Bar
| Element | Description |
|---|---|
| Vehk logo | Return to Overview |
| Axle / Fleet Owner | Switch between views (if applicable) |
| Shortcuts | Quick access to common actions |
| Customize | Dashboard layout preferences |
| Emergency | Quick access to critical actions |
| Notifications | View all notifications |
| Profile | Account settings, logout |
Tips for Fleet Managers
Daily Workflow
- ✅ Check Active Alerts - address any red/orange alerts first
- 📊 Review Today's Predictions - plan upcoming maintenance
- 🚗 Monitor Tracking Vehicles - ensure fleet is connected
- 📈 Check Fleet Health trend - look for declining patterns
Best Practices
- Review predictions daily
- Act on high-confidence predictions (>85%)
- Use RUL estimates for scheduling
- Export weekly reports for management
Next Steps
- API Integration - Connect your systems
- Getting Started - Initial setup guide